


House prices in Purmerend
The Purmerend housing market in up-to-date figures: asking prices, price per square metre, what is for sale right now and (unique to Huisverklikker) which homes are dropping in price.
The municipality of Purmerend has, according to Statistics Netherlands (CBS), 95,912 residents. There are currently 369 homes for sale, with an average asking price of € 527,087. Over the past 90 days, 67 asking prices were reduced, by -5.6% on average.
Current supply in Purmerend
The key figures right now: what is for sale, at what price, and how much has recently been sold or reduced.
Overbidding in Purmerend
How often homes sell above the asking price in the Purmerend region, by property type and nationally.
In the NVM region of Groot-Amsterdam, which includes Purmerend, 73% of homes sold above the asking price in Q3 2026, on average 5% above the last asking price. Nationally that share was 66%, down from 71% a year earlier.
By property type
The region Purmerend belongs to (Q3 2026), alongside the national average.
| Groot-Amsterdam region | Whole of the Netherlands | |||
|---|---|---|---|---|
| Above asking | % gap | Above asking | % gap | |
| terraced houses | 69% | +3.1% | 73.8% | +4.3% |
| end-of-terrace houses | 63% | +2.8% | 67.9% | +3.1% |
| semi-detached houses | 52% | +0.4% | 62.5% | +2.3% |
| detached houses | 29% | -2.4% | 43.7% | -0.1% |
| apartments | 78% | +6.2% | 70.1% | +4.5% |
The “% gap” is the average difference between the last asking and sale price (positive means sold above asking). National = weighted average across all 40 NVM regions by number of transactions, Q3 2026.
Source: NVM, Market overview per region Q3 2026 (the Purmerend region and the property-type-weighted national average across all 40 regions) and Housing market analysis Q3 2026 (national total).
Price drops in Purmerend
Homes whose asking price was recently reduced, each with our full dossier.
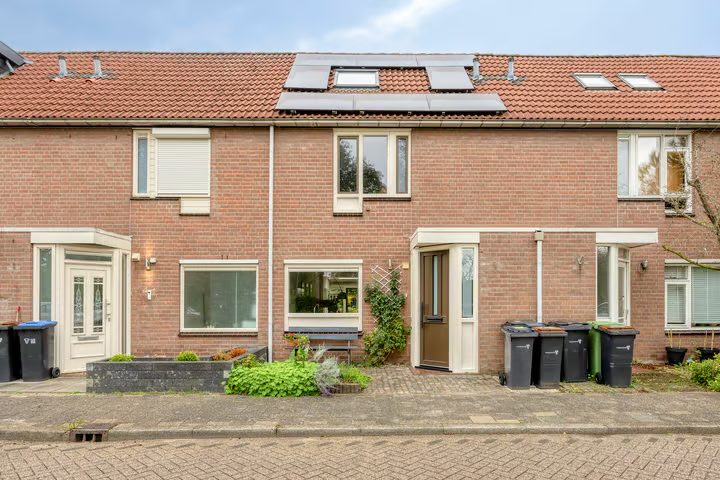
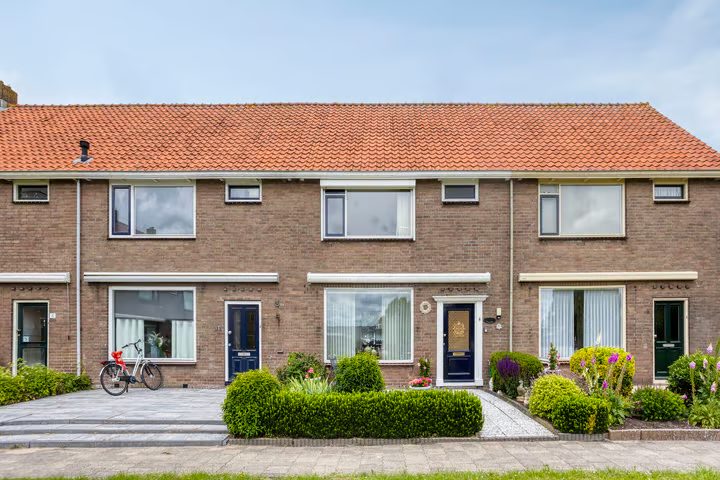
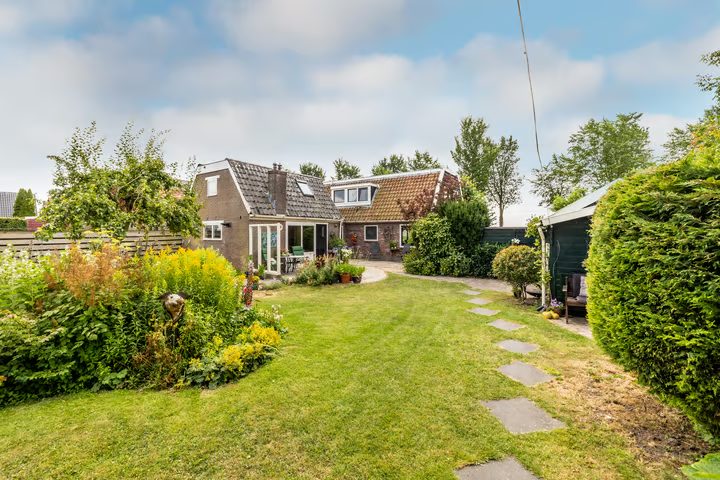
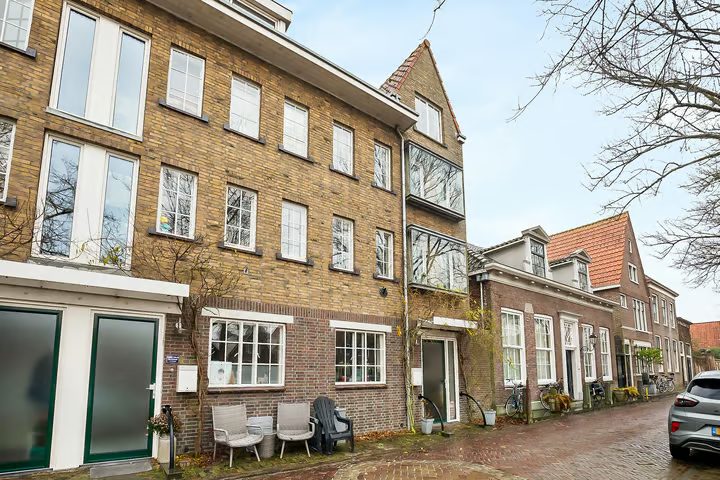
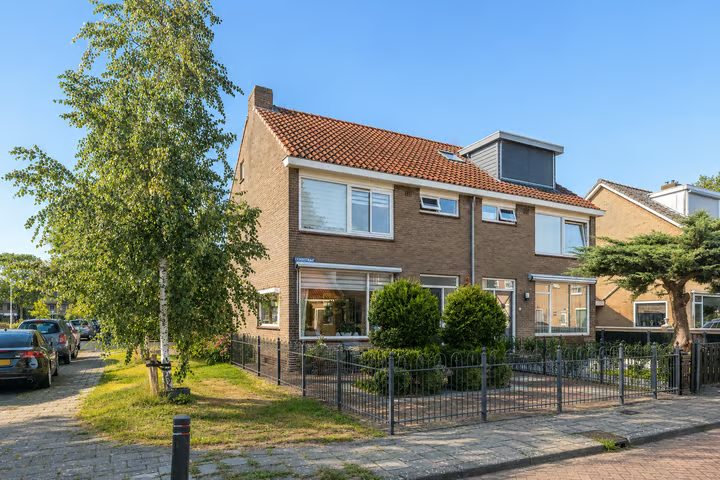
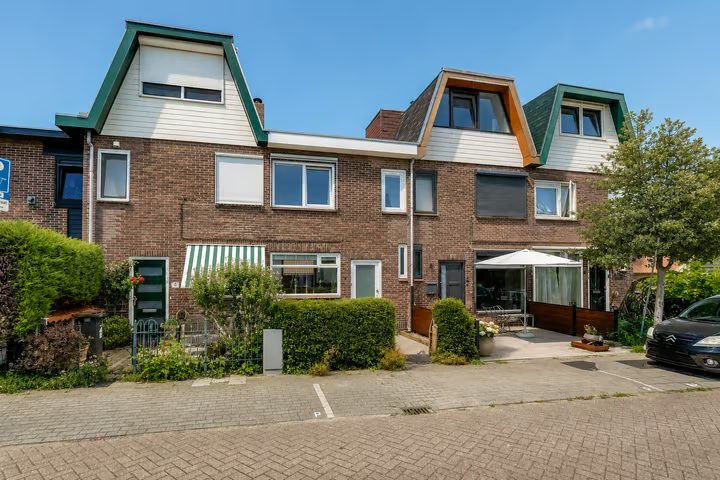
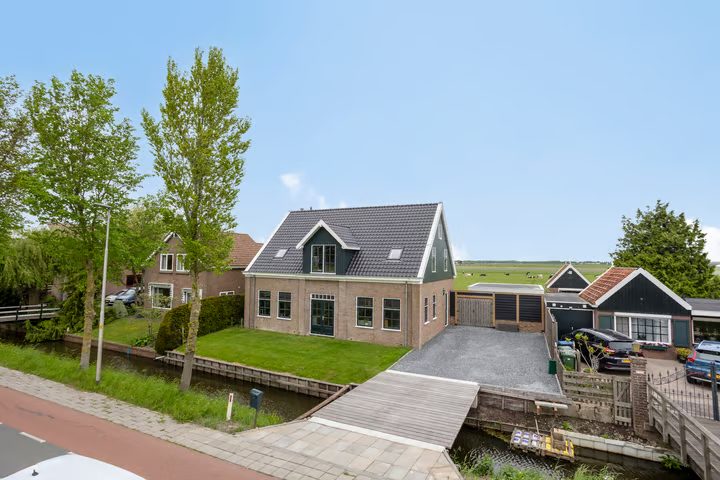
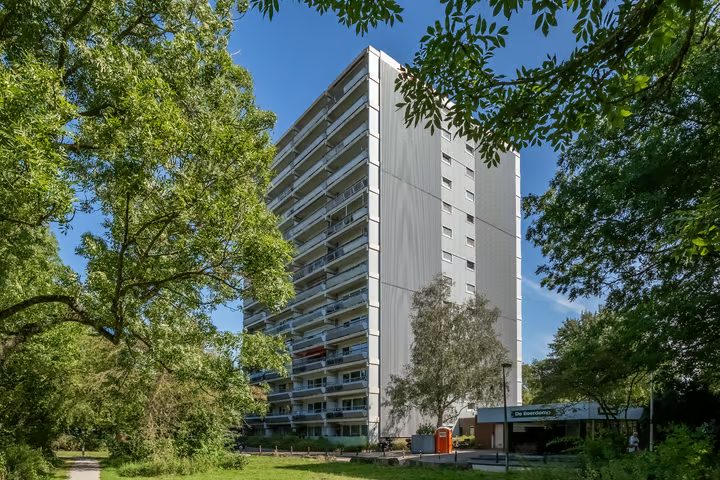
Over the past 30 days we tracked 78 price cuts in and around Purmerend, averaging −5.4%. The biggest cut was € 550,000 (Den Ilp 201, Den Ilp). Last updated 19 October.
In Purmerend, an average of 4.2 homes come onto the market each day, against 0.7 price reductions per day. That is a ratio of 17.9%: the higher this share, the more the market is cooling.
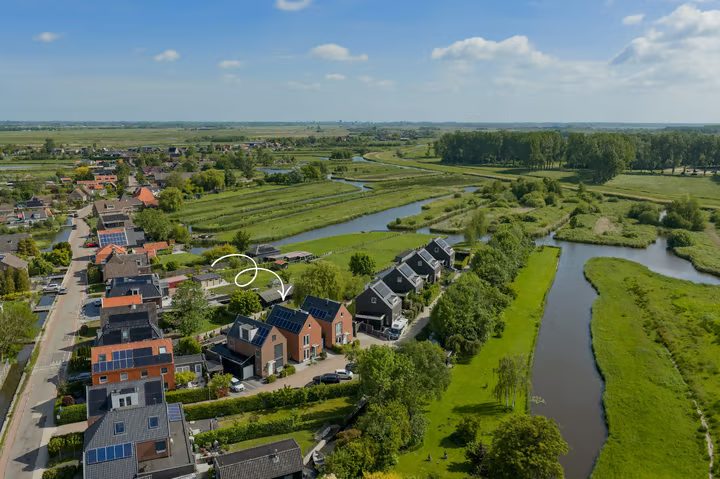
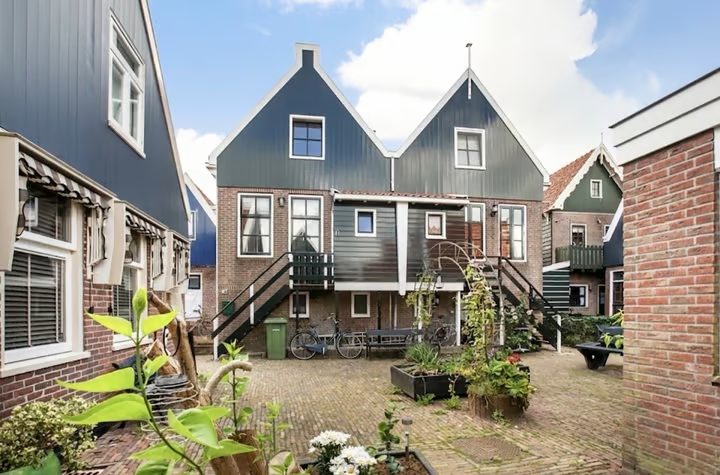
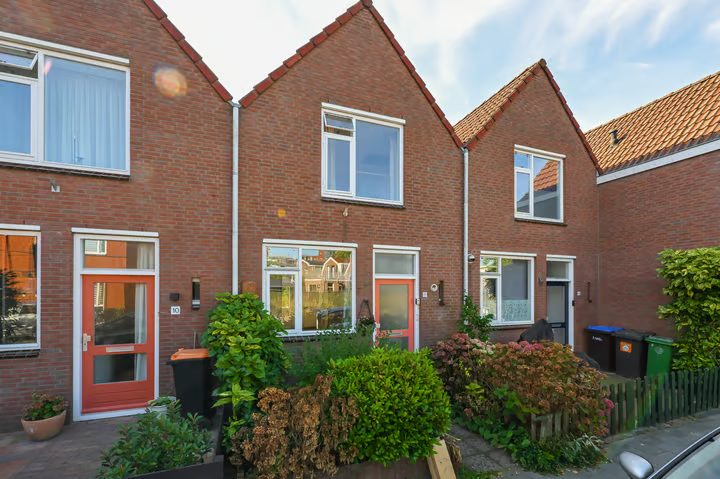
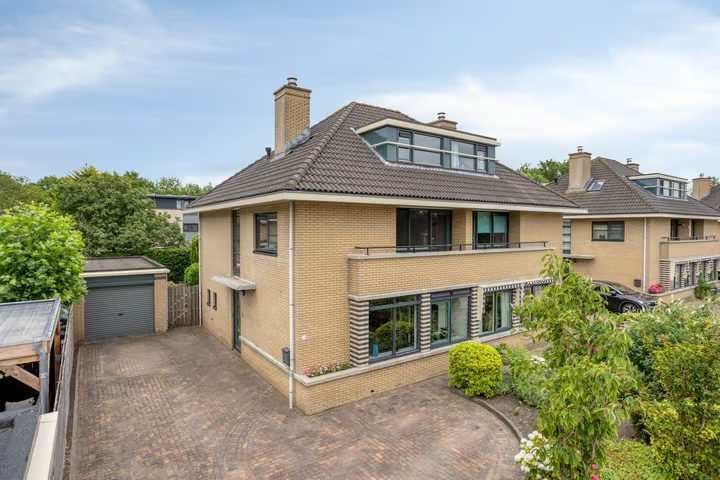
Biggest price drops · past week
Open one and you get the full dossier. Free, no account needed.
The Purmerend housing market in charts
At the top, the price distribution of the current supply; below it, the multi-year price trend compared with the Netherlands.
Price distribution of the supply
Number of homes for sale per price band (× € 1,000). Hover over a bar for the exact count.
Price trend vs. the Netherlands
Average sale price per year (CBS, existing owner-occupied homes). Hover over a point for the year and amount.
The top chart shows the price distribution of the homes currently for sale in Purmerend, so you can see which price band the supply mostly sits in. The bottom chart shows how the average sale price has developed over the past years (CBS) and compares Purmerend (orange) with the national average (grey). Notably, the price per m² in Purmerend is significantly higher than the national average, at € 5,296 versus € 5,105 nationally.
Between 2019 and 2025, the average sale price in the municipality of Purmerend rose from € 295,650 to € 472,491 (+59.8%). That puts Purmerend 1.5% below the national average. Source: CBS StatLine, existing owner-occupied homes.
Current market and outlook
The average asking price in Purmerend currently stands at € 527,087. Over the past year, we saw a rise of 8.8% (CBS), pointing to an active housing market in Purmerend. How tight that market is exactly, you can read further down under Market pressure. For up-to-date information on specific homes, see the supply and recent price drops below.
Market pressure in Purmerend
How tight is the market right now, based on our own current supply and sales data.
At the current pace of sales, Purmerend has roughly 3.9 months of supply. That makes it a balanced market (in balance) right now.
For comparison, the official NVM market-tightness indicator for the whole Groot-Amsterdam region stood at 3.5 in Q3 2026.
Property types in Purmerend
The current supply in Purmerend, broken down by property type.
| parking | 4× | € 48,000 |
| apartment | 203× | € 464,461 |
| house | 162× | € 617,393 |
Asking price of the current supply; NL = NVM transaction price. Most common in Purmerend: apartment (203 of the current supply).
Purmerend vs. the Netherlands
Current supply based on our own market data.
| Metric | Purmerend | Netherlands |
|---|---|---|
| Average asking price | € 527,087 | € 650,701 |
| Price per m² | € 5,296 | € 5,105 |
| Price reductions (90 days) | 67 | 13,771 |
NVM quarterly figures for the Groot-Amsterdam region (Q3 2026)
Sales figures from NVM agents in the region of this city, as a benchmark alongside the current supply above.
In the NVM region of Groot-Amsterdam, which includes Purmerend, the average transaction price in Q3 2026 was € 578,000 (+0.6% year on year). 3,907 homes changed hands in the region. Nationally, the average transaction price in Q3 2026 was € 503,000.
Most expensive home for sale in Purmerend
Based on the current supply.
Frequently asked questions about Purmerend
House prices in other cities
Compare the housing market with cities of similar size.
Want to keep following every price drop in Purmerend?
See all price dropsSources: our own Huisverklikker market data (updated daily), CBS StatLine (residents; sale prices of existing owner-occupied homes), NVM market information and regional NVM market overviews (Q3 2026), supplemented with public market data (reference date 2026-07-19). No rights can be derived from these figures.